As you will see, on some of the days something was happening with air pressure, and this affected my Garmin's altimeter. I don't remember going below sea level!
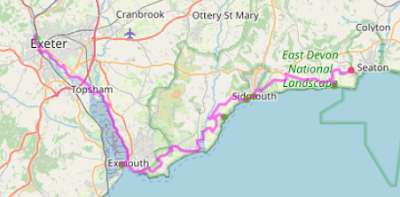 |
| Day 1 - Exeter to Beer |
 |
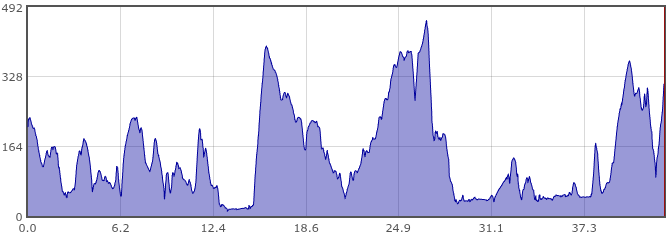
| Day 1 elevation |
 |
| Day 2 - Beer to Abbotsbury |
 |
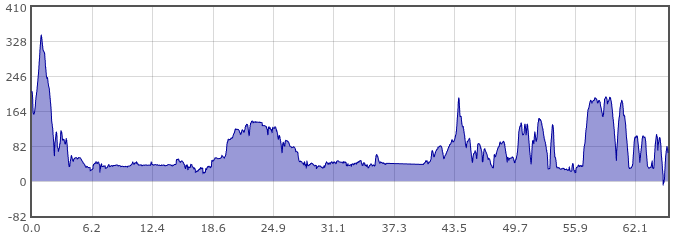
| Day 2 elevation |
 |
Day 3 - Abbotsbury to Osmington Mills
|
 |
| Day 3 elevation |
 |
| Day 4 - Osmington Mills to Swanage |
 |
| Day 4 elevation |
 |
| Day 5 - Swanage-Wootton Bridge IoW |
 |
| Day 5 elevation |
 |
| Day 6 - Wootton Bridge-Totland |
 |
| Day 6 elevation |
 |
| Day 7 - Totland IoW - Gosport |
 |
| Day 7 elevation |
 |
| Day 8 - Gosport-East Wittering |
 |
| Day 8 elevation (rising pressure?) |
 |
| Day 9 - East Wittering-Hove |
 |
Day 9 elevation (the 'big' hill at the end
is the hill from the beach up to Hove station) |
Mileages
There were some very hilly days, with the second day (Beer to Abbotsbury) appearing in the top 10 hilly days of the whole trip round the coast. 344% is exceptional.
That's all for this trip!


It looks to me as if Day 9 is a reverse of the earlier altimeter issues. That's unless the south coast is rising at the rate of about 4 feet an hour 🤣. This would avoid any chance of global warming inundating the coast but might imply an imminent volcanic eruption.
ReplyDeleteWow, super impressiv😮 thank you for the photos etc. Now for a rest ?????😊
ReplyDelete